Opened 11 years ago
Closed 10 years ago
#451 closed defect (fixed)
Profile petascope regarding RAM usage
| Reported by: | Dimitar Misev | Owned by: | Piero Campalani |
|---|---|---|---|
| Priority: | major | Milestone: | 9.0.x |
| Component: | petascope | Version: | 8.5 |
| Keywords: | Cc: | damiano, Peter Baumann, mantovani, Piero Campalani | |
| Complexity: | Medium |
Description
It seems like petascope/tomcat is using quite some memory after many WCS requests. We should check for memory leaks and the like by e.g. monitoring with top and the NetBeans profiler during a session of 1000 queries sent to petascope. These queries could come from the wcs/wcps tests in the systemtest.
Attachments (4)
Change History (15)
comment:1 by , 10 years ago
| Owner: | changed from to |
|---|---|
| Status: | new → assigned |
comment:2 by , 10 years ago
| Status: | assigned → accepted |
|---|
comment:3 by , 10 years ago
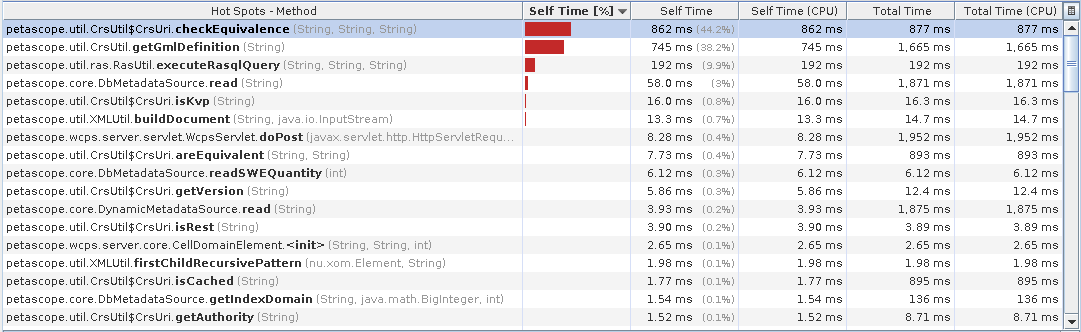
I profiled a simple query
for c in (eobstest)
return avg(c)
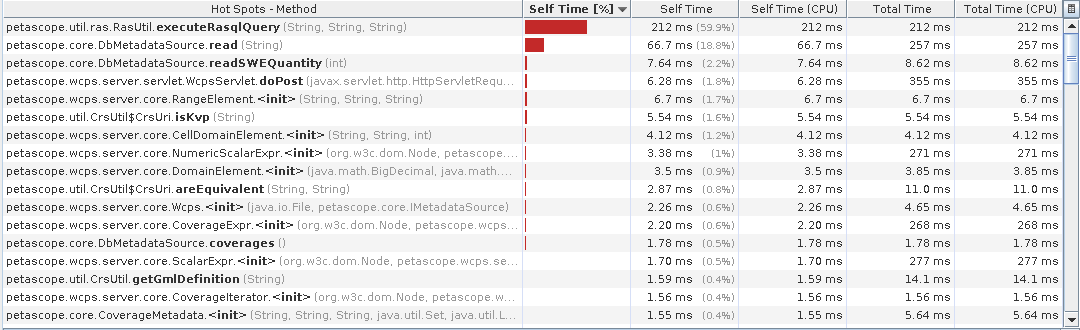
The first run loses a lot of time on CRS parsing and checking, but second time caching already fixes that as it seems.
Attached the results.
comment:4 by , 10 years ago
Good that the caches work fine, but still the RasQL execution represents a 60% of the overall response time: ideally I'd say it should be around 80%.
comment:5 by , 10 years ago
I think it's still reasonable, note that the rasql will take significantly more on more complex queries. It's not so critical to optimize it to death. But it would be good to check on the memory usage.
comment:6 by , 10 years ago
Looking at the absolute times anyway, we're in the ms scale. On a tougher query the RasQL time increases while Petascope overhead should be fixed.
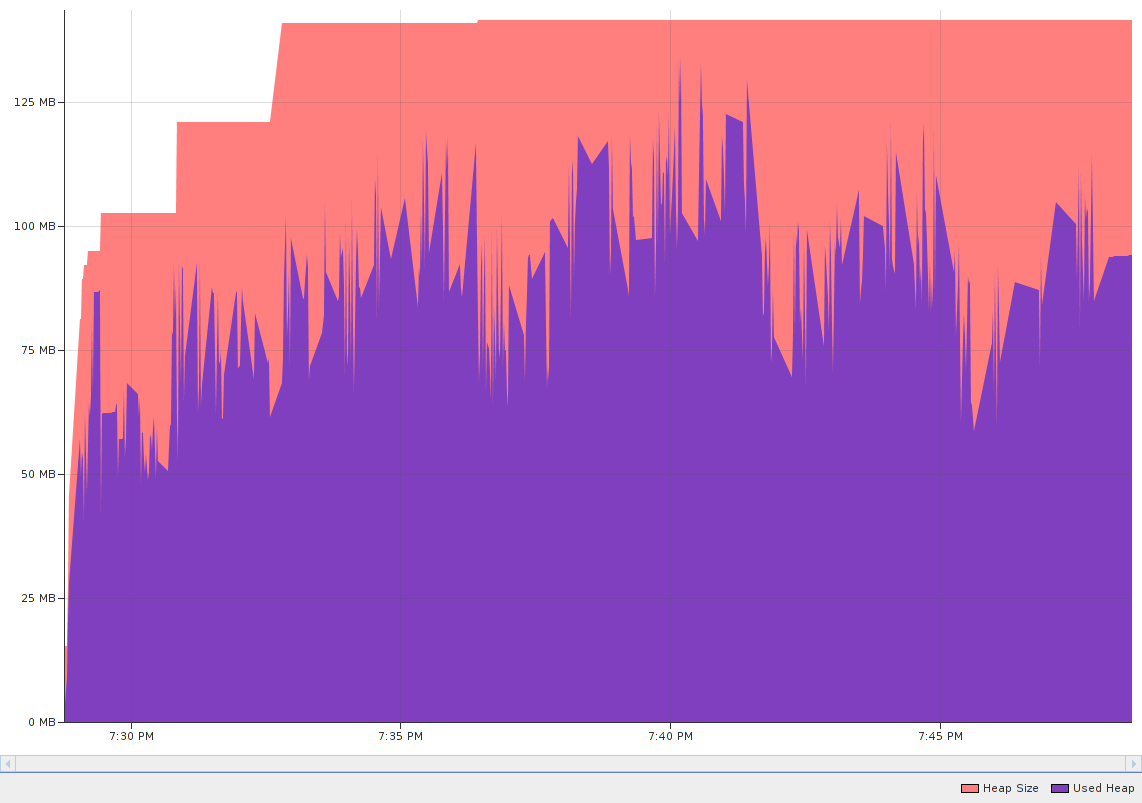
by , 10 years ago
| Attachment: | petascope_heap_WCS10x.png added |
|---|
Heap profile for 10 consecutive WCS systemtest runs.
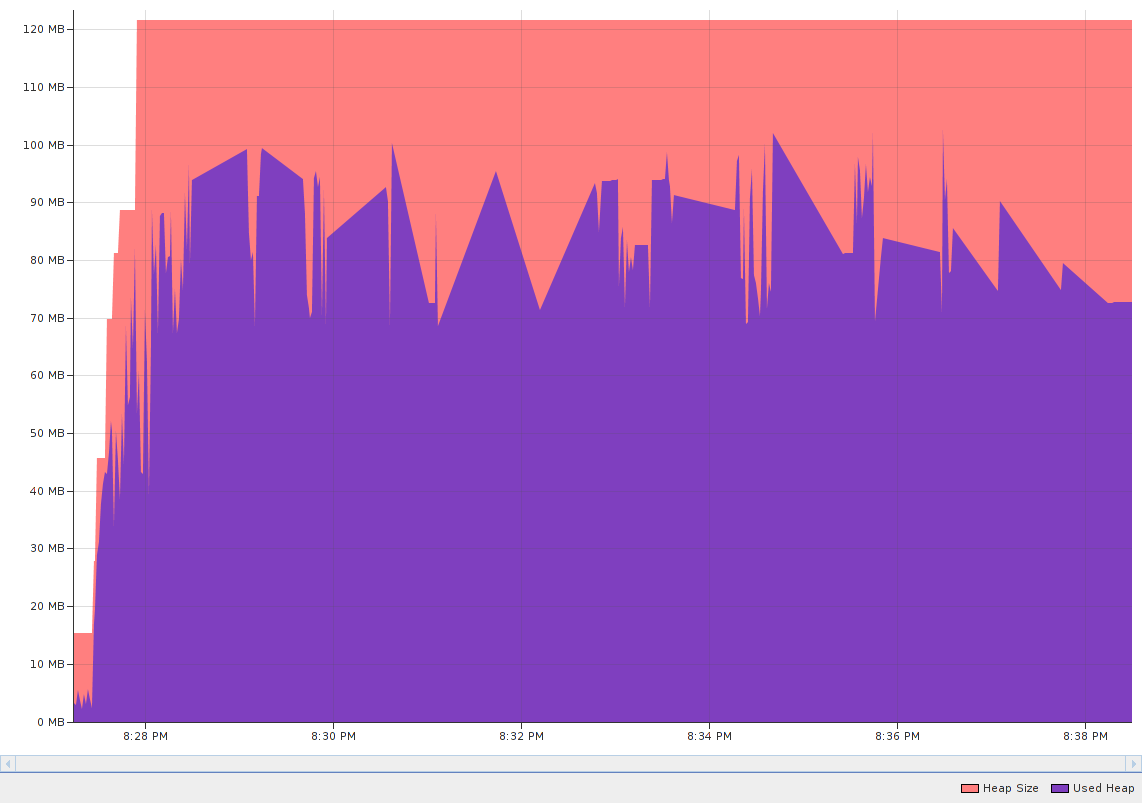
by , 10 years ago
| Attachment: | petascope_heap_WCPS5x.png added |
|---|
Heap profile for 5 consecutive WCPS systemtest runs.
comment:7 by , 10 years ago
I made a preliminary general profiling of the heap usage of Petascope by running WCPS and WCS tests several times (5x and 10x respectively).
Looking at the telemetry plots, I generally see a stable behavior, WCS queries eating a little more memory as expected (~150 MB versus ~120MB for WCPS).
Comments/ideas?
Let me know if I should proceed with more detailed (objects/snapshots) profiling.
comment:8 by , 10 years ago
Would be good to profile the GetCapabilities issue to see where the time is mostly spent.
Not sure if you've tested for memory leaks specifically?
comment:9 by , 10 years ago
Yes, the surviving generations' count is stable throughout the run, so there does not seem to be any leak.
Good idea: I'll profile the GetCapabilities (for #735 too).
comment:10 by , 10 years ago
comment:11 by , 10 years ago
| Resolution: | → fixed |
|---|---|
| Status: | accepted → closed |
I'd put in this ticket the profiling of performances too.